Overview
PotterViz is an interactive data visualisation of the Harry Potter universe, built as part of the EPFL Data Visualisation course. Rather than a traditional analysis, the goal was to construct a narrative journey through the series — guiding the reader from books and films, through the characters and their allegiances, down to individual spells and wand components.
The project was developed by a team of three. All seven books, eight films, and several supplementary datasets (character lists, spell databases, interaction networks, box office figures) were collected, cleaned, and merged in Python before being fed into the interactive front-end.
Data sources
- Full text of all seven novels — for spell timelines and word analysis
- Character interaction networks from the Harry Potter Collection database
- Spell and potion databases with category and frequency metadata
- Box office and sales figures from Wikipedia; character rankings from The Guardian
- Kaggle movie transcripts for sentiment analysis of dialogues
Visualisations
All charts were built in D3.js and run entirely in the browser. The site is structured as a scrollable story — each section zooms in on one facet of the universe.
House explorer — an interactive portrait gallery for each of the four Hogwarts houses. Clicking a house reveals all its characters with photos, their traits, and key facts. The data was sourced from the HP Collection database and enriched with image assets.
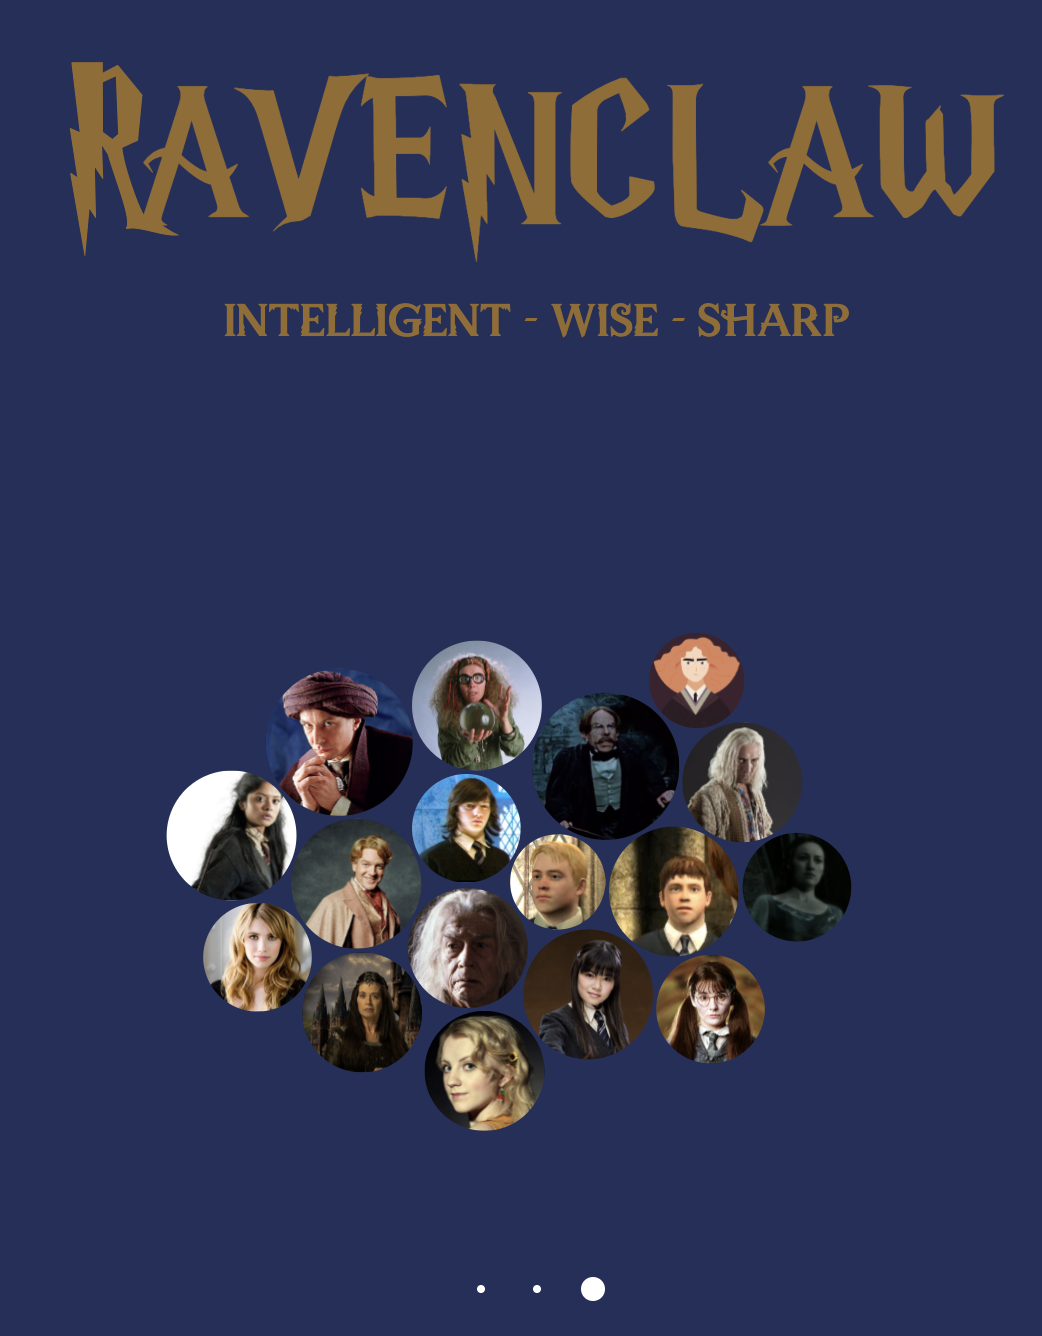
House explorer — Ravenclaw view with character portrait bubbles.
Character groups network — a force-directed graph mapping the social fabric of the series. Nodes are characters; edges encode shared group membership (Order of the Phoenix, Death Eaters, Dumbledore's Army, Hogwarts staff, and more). Searching for a character highlights their cluster and the groups connecting them to the rest of the cast.
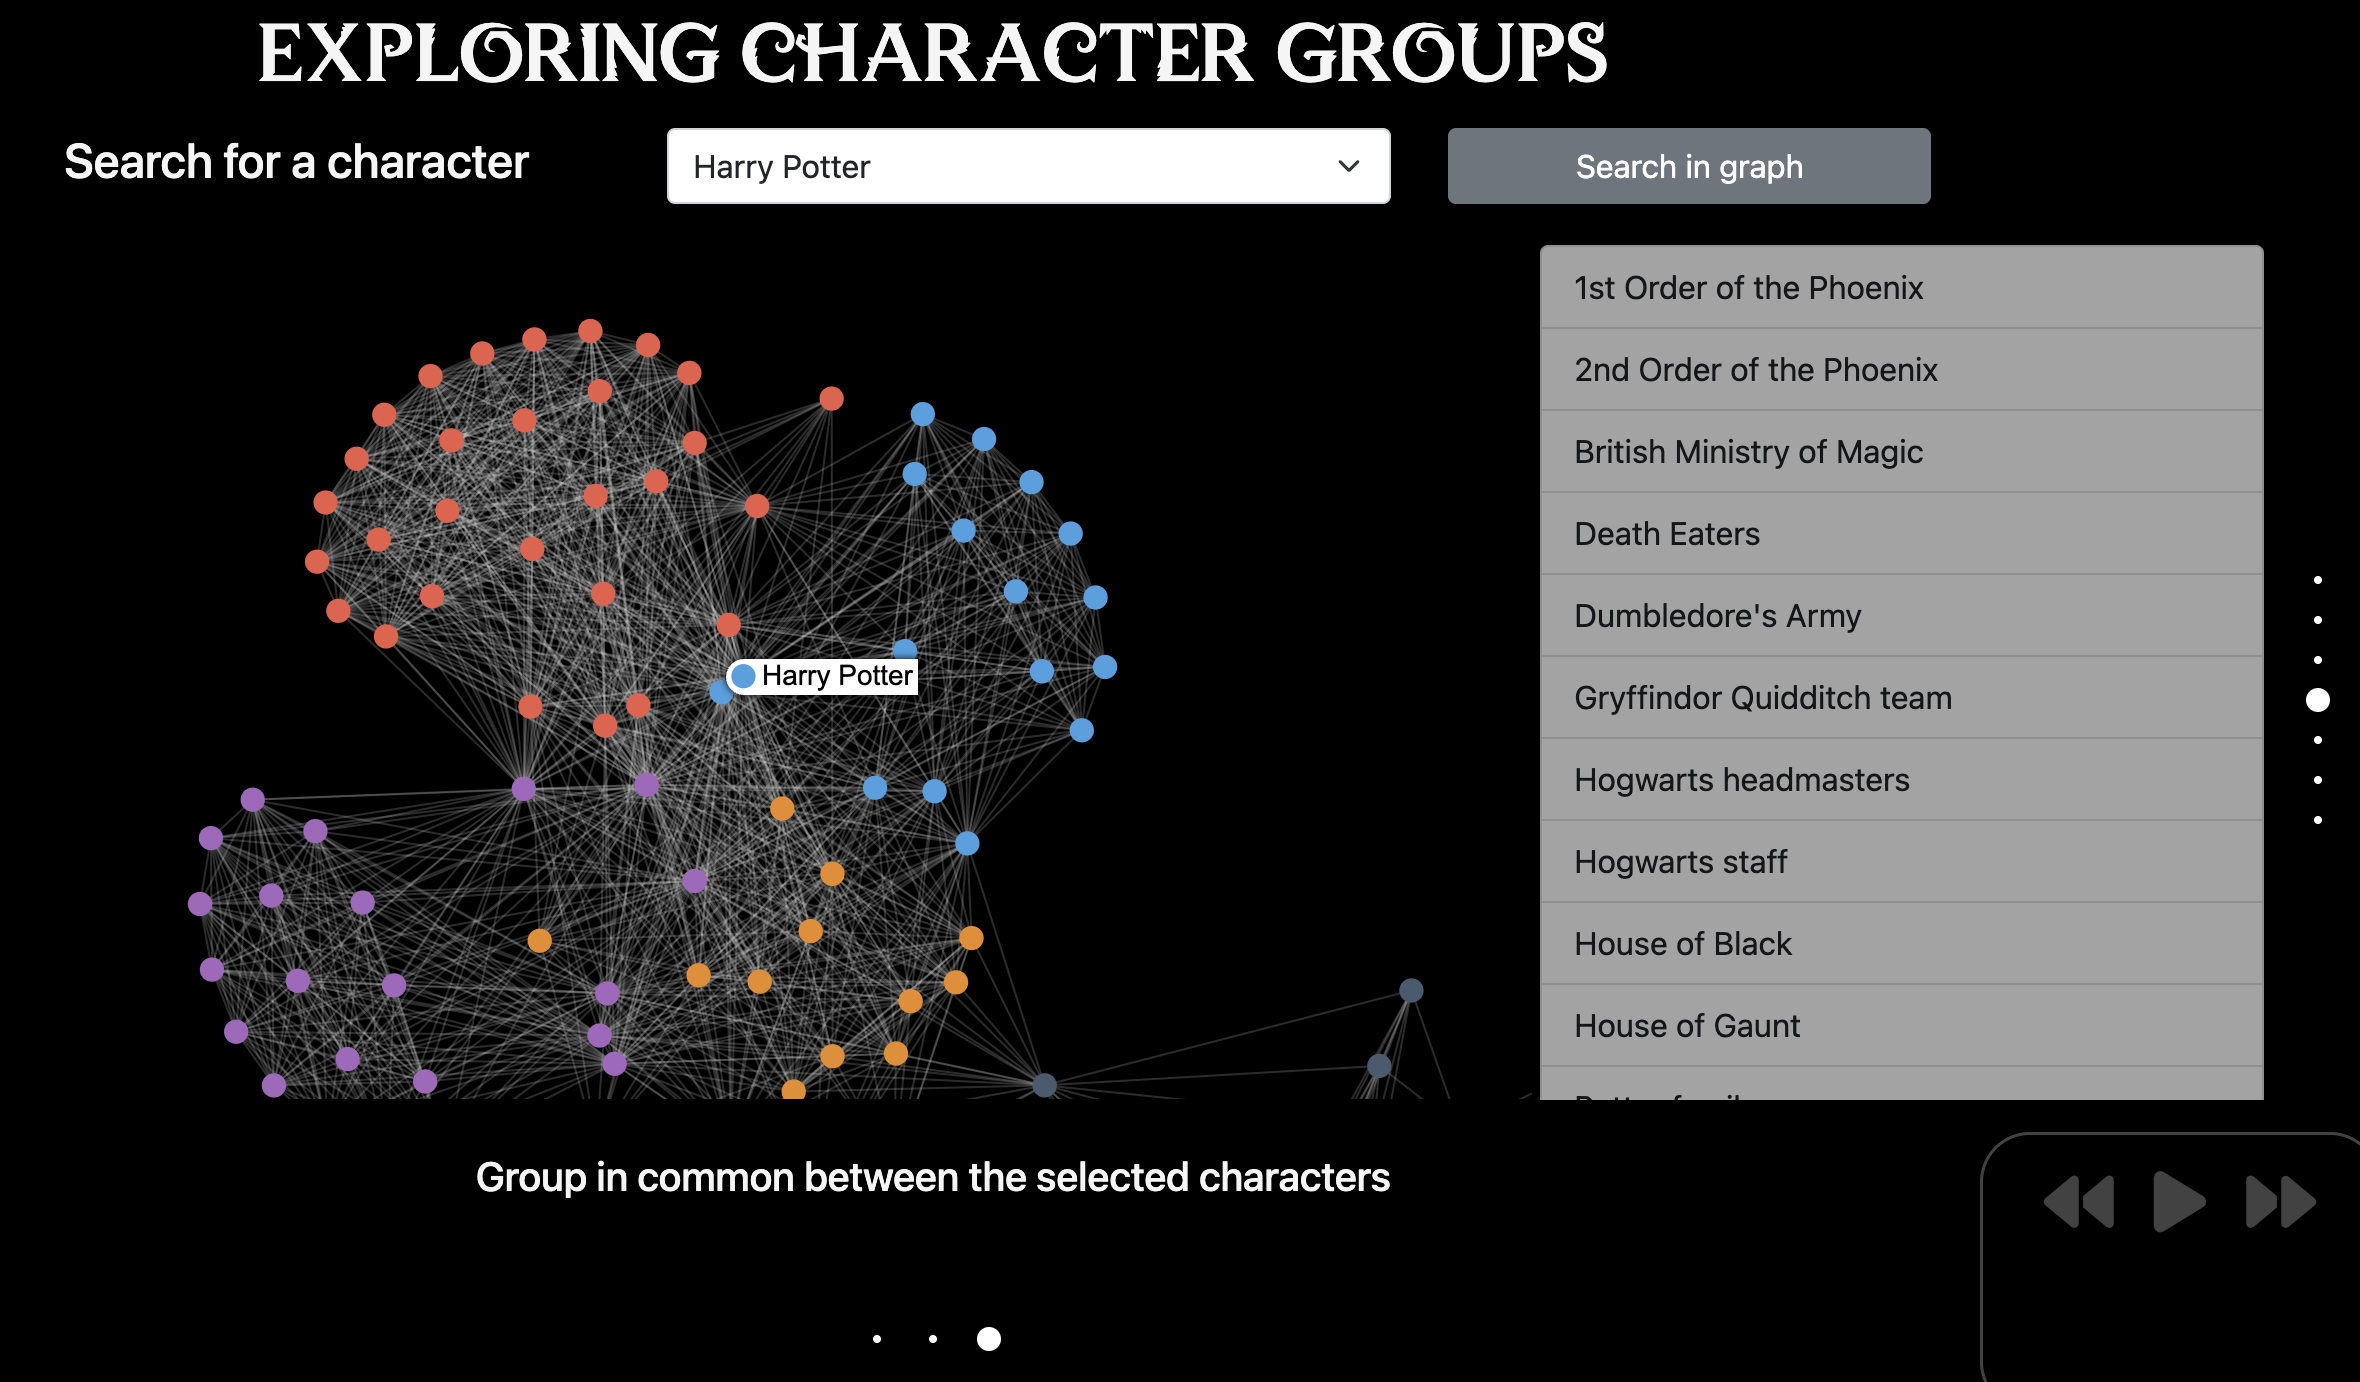
Character groups network — Harry Potter selected, colour-coded by faction.
Spell timeline — a bubble chart plotting the 20 most-used spells against their position in the combined book text (x-axis: word count; y-axis: spell name). Each bubble marks a cast, coloured by book, making it easy to see which spells dominate early in the series and which only appear once the conflict escalates in the later volumes.
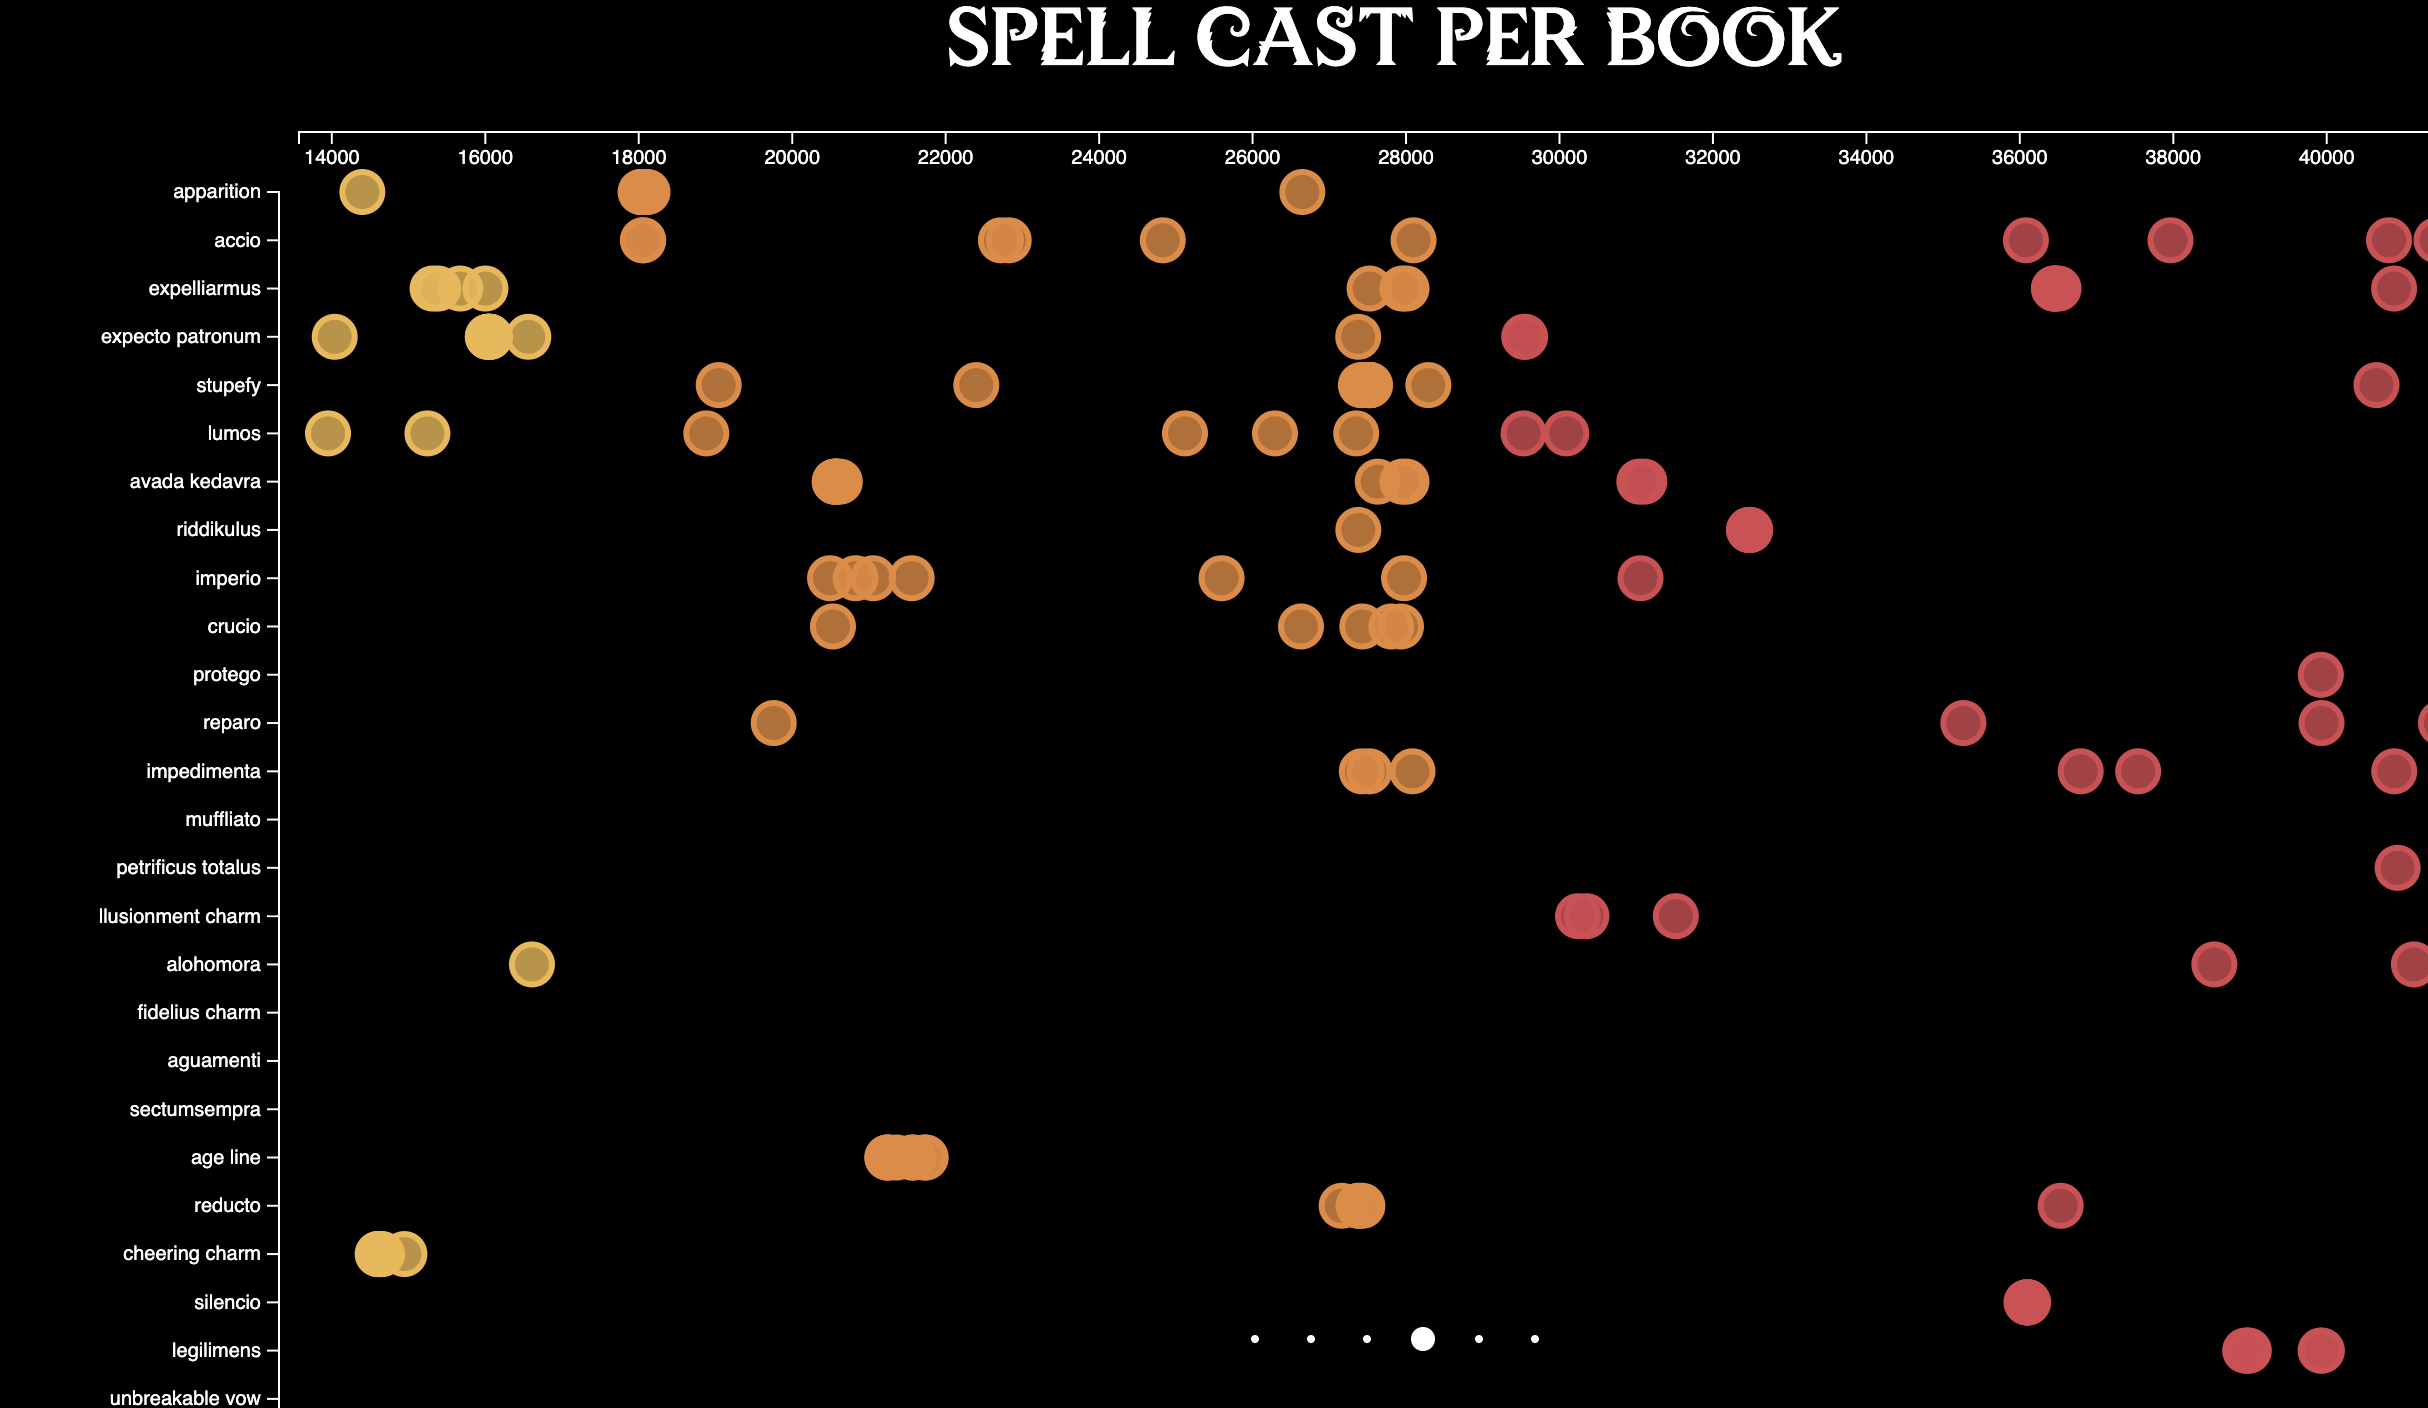
Spell cast per book — each bubble is one cast, x-axis is word position across the series.
Other views in the full site include a Sankey diagram of wand wood types and cores, a spell-category breakdown, per-book word clouds, and a sentiment arc derived from film dialogue transcripts.